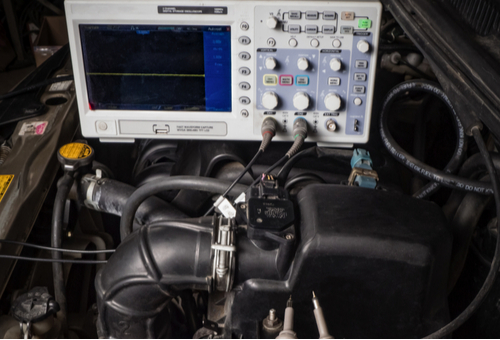
The transition into this writer’s (almost) second career path as a mobile diagnostician since his semi-retirement happened by accident, and while we don’t have to go into the details of that happy accident here, what this writer can say is that most of his consultations happen in small independent workshops. More specifically, in small independent workshops that a) often cannot afford to keep scan tools updated, b), often cannot afford dealer-level scan tools, and/or subscriptions to access OEM service information, and c), often try to diagnose complex issues without adequate diagnostic equipment.
This last point is relevant to this article in the sense that many “complex” diagnostic issues can be diagnosed relatively easily with an oscilloscope, and in particular, with a multi-channel digital storage oscilloscope that can record live date in “movie” format. Having said that, this writer has also noticed that many technicians and mechanics across all ages and skill levels display a distinct resistance to using oscilloscopes in diagnostics because oscilloscopes are considered difficult to use, and their (displayed) results are almost impossible to decipher. Nothing could be further from the truth, and in this article, we will take a closer look at how an oscilloscope can be used to diagnose some kinds of issues in seconds, as opposed to in hours using conventional means. Let us start with this question-
This writer gets this question a lot from young and inexperienced mechanics, and while it would be tempting to answer "yes", doing so would be misleading, even though it is theoretically possible to obtain waveforms of all forms of energy that are generated in, or by, almost any part of any modern vehicle. So what is the problem?
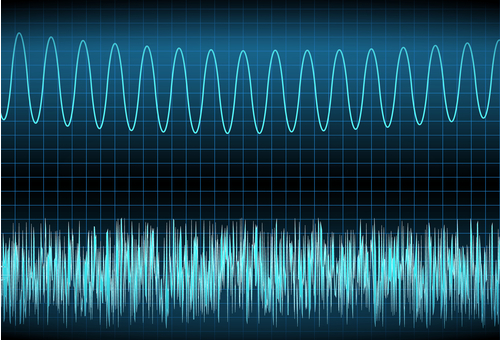
The problem is that just because something can be done, does not mean that it should be done, or having done it, that the results would be usable. Note though that while this article is not intended to be a tutorial on how to interpret waveforms, it is nevertheless instructive to consider the two waveforms in the above image as examples of both the usefulness and limitations of oscilloscopes as diagnostic tools. Let us look at the-
The top waveform is an example of a typical sine wave, and while this particular generic example does not apply to any diagnostic issue, the waveform delineates the energy input's amplitude and frequency, which is what defines or describes the overall intensity of the energy input. In this example, deviations in the frequency, amplitude, and/or shape of the waveform could be indicative of issues in the system/component that is under investigation. On the other hand, regular, cyclical deviations in the frequency, amplitude, and/or shape of the waveform might be expected, and the deviations would, therefore, tend to confirm the correct operation of the system or component that is under investigation.
Overall though, the shape, frequency, and amplitude of a displayed waveform is as much a function of whether a waveform is digital or analogue in nature (depending on the system/component under investigation) as it is a function of both the selected oscilloscope settings and the basic functionality/capabilities of the oscilloscope in use.
The second example waveform in the above image is a typical example of compounded waveforms that contain little to no useable diagnostic data. This kind of waveform is typical of NVH (Noise, Vibration, and Harshness) issues in which input data is obtained with multiple microphones, accelerometers, and other devices placed at different locations on a vehicle. The biggest problem with this kind of diagnostics is that it is impossible to completely isolate any possible source of noise or vibration from any other possible competing or contributing sources of noise and vibration. In practice, some sound and/or vibration generated by a particular component is almost always transmitted to all or most other parts of the vehicle through control arms, body panels, suspension bushings, driveline components, and even through wheels and brake lines.
The result of such jumbled inputs is a compounded waveform that is impossible to decode, and while it might be possible to “clean up” the waveform somewhat by reducing the oscilloscope's sampling rate, doing this could filter out some diagnostic information. One other possible solution could be to reduce the number of inputs, but depending on the system/components being investigated, sounds and/or vibrations transmitted from elsewhere through the vehicle's structure could still potentially render a waveform useless.
Therefore, for an oscilloscope to be effective as a diagnostic tool, it is best used on systems and/or components that produce frequencies that fall between the two examples shown above. Put differently, and although this may sound counterintuitive, the simpler a waveform is the more useful diagnostic information it typically contains, and the easier it is to detect anomalies and/or deviations from the expected waveform. In the sections that follow this, we will examine some relatively simple waveforms of common issues that can be easily diagnosed with an oscilloscope, instead of by other means such as multi-meters, various compression testers, or even invasive methods such as dismantling of engines. Let us start with a simple-
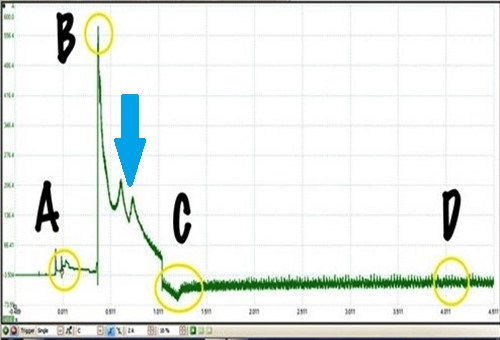
Image source: https://www.searchautoparts.com/sites/www.searchautoparts.com/files/images/Figure-6-copy.gif
While there are several ways to diagnose batteries and charging systems, no single method will provide you with a way to visualise what is happening the system in the same way that an oscilloscope can. Consider the example trace above, which was obtained from a vehicle with a known good battery and charging system-
This particular trace spans over 5 seconds, but let us look at what the labels represent-
The distance (time-lapse) between "C" and "D" indicates the steady operation of the alternator, with all electrical consumers off or deactivated. Any additional load on the electrical system will show as momentary dips in the alternators' operation, but note that any such dip must be followed immediately by a ramp-up to a stable power output from the alternator.
Required scope settings
Note that while the above connections will produce a trace similar to the one in our example above, there will likely be differences in detail caused by variations such as engine temperature, cranking time, battery condition, and others. Nonetheless, traces of this type are sufficiently similar to each other to make obvious defects in batteries and/or charging systems clear even to novice oscilloscope users.
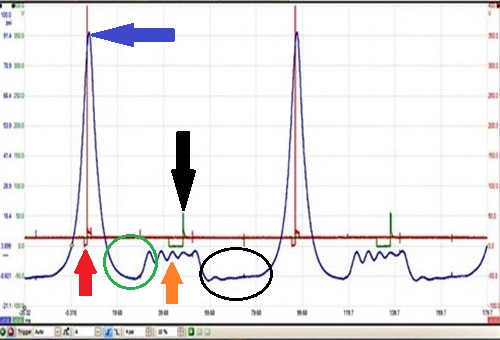
Image source: https://www.searchautoparts.com/sites/www.searchautoparts.com/files/images/Figure-7-copy.gif
Diagnosing misfires is arguably the problem we spend the most time on, and as we know, we sometimes have to dismantle engines to find the root cause(s) of some misfires if relative compression and other tests done in conventional ways do not yield usable results.
Now, however, we have a way to “see” pressure changes inside cylinders almost as they happen, which obviates the need to dismantle engines, which if the truth were told, is something not many of like to do unless there is no other way to diagnose a misfire. So with this in mind, let us consider the example scope trace above-
This example was taken from a known good engine with a scope attached to an in-cylinder pressure transducer, which converts pressure changes to changes in voltage, which the oscilloscope then displays as a trace. In this case, 3 channels on a multi-channel scope were used to capture the compression pressure, along with an ignition trace and an injector trace for reference purposes. Overall, the trace represents two consecutive, 720-degree engine cycles captured from one cylinder, but let us look at what the arrows and circles mean-
Limited space precludes an in-depth discussion of all the information contained in this trace, beyond saying that any defects in the form of leaking valves, improper valve timing, worn cylinders/rings, improper ignition and/or injection timing, and even leak paths in cylinder head gaskets, including leak paths between adjacent cylinders, will show up in traces like this. While learning to recognise one or more of the listed faults in a scope trace does involve a rather steep learning curve, many online resources maintain comprehensive waveform libraries for purposes of comparison. Other resources, such as mechanic.com.au may not maintain waveform libraries, but many technical websites, including mechanic.com.au host large online communities in which technical information is shared freely.
Required scope connections
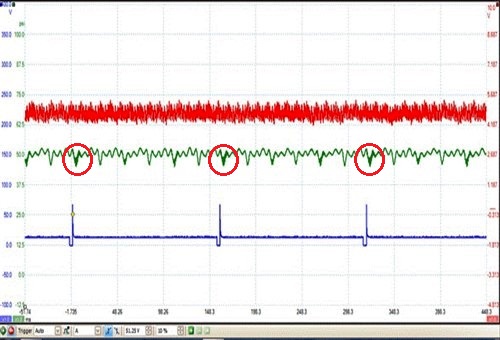
Image source: https://www.searchautoparts.com/sites/www.searchautoparts.com/files/images/Figure-8-copy.gif
Fuel systems or more precisely, issues in fuel systems can also take a lot of time to diagnose using conventional tests and means, which sometimes, fail to produce satisfactory results. However, when you use an oscilloscope to diagnose fuel systems, you can set it up so that you can see several aspects of the fuel systems’ operation on one screen. The example trace of a known good fuel system shown on a six-cylinder engine above is a case in point, so let us look at this screen in a little more detail-
The top red trace represents fuel pump current, and as is shown here, the pump is running at a constant speed using a constant current supply. The absence of major deviations, irregularities, and/or dropouts in the trace can be taken as evidence that the fuel pump and its power supply are both in good working order.
The bottom, blue trace represents injection events on one cylinder, which is obtained by back probing the control side of the injector. Note that a) the current spikes are even, which can be taken as evidence that the injector opens correctly during each injection event, and b), that the current drop off after each injection event is precipitous, which means that the injector driver circuit cuts current to the injector cleanly and completely. Oscillations in the drop-off ramp typically mean that the injector driver is not cutting current cleanly.
The middle, green trace is perhaps the most important element in this screen, since it represents fuel rail pressure, which is obtained by connecting a pressure transducer to the fuel rail’s test port. Note the six small dips in the trace between each injection event; these dips represent a cyclical drop in pressure across all six injectors every time an injection event takes place. Nonetheless, the evenness of the dips means that no injectors are leaking, but what do the red circles mean?
These indicate small, high-frequency pressure waves that reflect off the back and sides of the fuel rail every time the injector under test closes. In practice, these pressure waves are roughly analogous to the pressure waves that bounce around intake manifolds and runners and are not indicative of issues or defects in the fuel delivery system.
Note though that although (in this example) the strongest pressure waves occur on the injector closest to the injector being tested in this example, this is merely the result of the injector with the strongest pressure wave pattern being closest to the fuel rail’s test port. In practice, the further away an injector is from the test port, the more the pressure waves are damped out by the distance between the test port and the injector.
Required scope connections
The above connections will typically produce a screen that resembles the example shown here, but note that as with the other examples shown here, you may see some differences as the result of different oscilloscopes having different sampling rates, and/or other properties that may differ from the instrument that produced these examples, which leaves us with this-
Even though you may see slightly different results than the examples shown here, the point is that it is possible to use oscilloscopes to diagnose issues and problem in minutes, as opposed to hours in some cases. However, the secret of oscilloscope diagnostic lays not so much in figuring out which connections to make, as it lays in interpreting the data you obtain not only from examples such as the ones shown here but from almost any other system and/or component on any vehicle.
If you are new to oscilloscope diagnostics, the only advice this writer can offer in this regard is to obtain as many known good traces as you can from as many sources as you can, and then to join as many technical forums as you can to ask as many questions about your traces as you can. While it might take you a while to get the hang of oscilloscope diagnostics, once you do, you will never again use multi-meters and conventional methods to diagnose the most common (and not so common) issues you encounter daily.