An old truism holds that “a little knowledge can be a dangerous thing”, especially from our perspective as mechanics and technicians, since we both require, and use or process large amounts of data/information/knowledge to draw valid diagnostic conclusions, or to make reasonable inferences when we formulate diagnostic strategies. However, in the context of the car repair industry, the opposite is often also true because too much knowledge/data/information can, and often does, obfuscate the problems we are trying to diagnose and resolve on our customers’ vehicles.
All of us have been in situations where we had to decide which of several possible diagnostic paths to follow, some of which often lead nowhere, diagnostically speaking. Thus, in this article, we explain how to avoid following unproductive diagnostic paths by using a digital storage oscilloscope, since an oscilloscope will almost always point you in the right diagnostic direction by providing only the information you need, as opposed to all the information you would like to have. Before we get to the specifics of oscilloscopes, and why you need to use one more often, though, let us look at-
All of us own an arsenal of diagnostic equipment that usually includes one or more scan tools, sensor simulators, relay testers, breakout boxes, current probes/testers, a variety of amp clamps, and one or more digital multimeters, and all of these tools have their legitimate uses. In fact, we could not do our jobs effectively without these tools, but on the other hand, throwing all these tools at (some) diagnostic challenges simultaneously often creates a kind of “Which came first, the chicken or the egg?” situation.
Diagnosing communication codes is a good case in point. For instance, even if we use a scan tool that can a) display the layout of a serial communications system, and b) indicate which modules are not communicating, we have no way of telling what had caused the communications issue until we find the actual problem. This is an example of the chicken-or-the-egg situation; did a control module fail, or was there a wiring failure that necessarily affected one or more control modules’ ability to communicate?
So, as a practical matter, the problem we all have with gathering diagnostic information is that we often don’t know what is causing a problem, and as a result, we often don’t recognize the point at which we have gathered sufficient information to diagnose and fix the problem.
So how do we know we have sufficient information to diagnose and fix a problem on vehicles we have not seen before? If the truth were told, we often don’t know, but this article does not intend to teach anyone how to formulate a viable diagnostic plan or strategy. Nonetheless, this writer would like to suggest that there is an easy way to cut through the (diagnostic) white noise to extract just the information we need, as opposed to gathering all the information we possibly can- much of which sometimes obfuscates the problem we are trying to diagnose, so let us consider-
If you are new to the car repair industry, you probably have not yet fully appreciated the facts that a) all cars largely work in the same way, b) that similar failures on all cars occur for largely the same reasons, and c) that the basic laws of physics and electricity do not change between vehicle makes and models.
So what does this mean in practice? It means that in terms of the scientific laws and principles that underpin the control systems of all modern vehicles, there are more similarities between vehicle makes* and models than there are differences- despite the differences in the technical implementation of some systems that exist between vehicle makes and models.
*Note that electric and hybrid vehicles are excluded from this statement. While a similar principle applies to both categories of vehicles, both vehicle categories are sufficiently different from conventional vehicles to require specialized training, equipment, and skills to work on their high-voltage systems.
At the risk of overstating the case, we can expand the above statement a bit further by saying that apart from their outward appearance(s), there are no material differences between modern vehicles. All contain largely the same components that are assembled to largely the same pattern, and all rely on electricity to make the vast majority of their components work as designed.
So, how does any of the above helps us? It’s simple really; if we think about the above statements objectively, it should be obvious that since all conventional vehicles work in much the same way, we should be able to use a single piece of diagnostic equipment to diagnose a large percentage of issues on all vehicles by following largely the same processes and principles, and we can do just that with a digital storage oscilloscope.
Of course, the proverbial devil always lives in the details, and in this case, the details involve having to learn how to interpret waveforms, which are visual representations of how electrical currents are flowing to, from, and through components like actuators, motors, sensors, rheostats, and the like.
However, the upside of waveforms is that (among others) things like spark events, CAN system operation, sensor outputs, and current draws all produce the same type of waveform, regardless of the vehicle they were taken from. The practical advantage of this is that if we investigate something like for example, a misfire, we can obtain a visual representation of the spark event in the form of a waveform that we can analyse and compare to waveforms taken from cylinders that are not misfiring.
Such an analysis can save a lot of diagnostic time, so let us take a closer look at how to use a-
This writer has often heard even experienced technicians say that oscilloscopes are difficult to use, and the data (waveforms) they produce are almost impossible to interpret and understand, but nothing could be further from the truth. Of course, learning to use an oscilloscope effectively involves a rather steep learning curve, but we deal with learning curves almost daily in our careers, so learning how to use an oscilloscope should not present anybody with undue difficulties.
However, as a practical matter, it is easy to remove much of the guesswork involved with using oscilloscopes simply by understanding how these instruments work, knowing what their limitations are, and how to overcome most limitations by understanding and exploiting the abilities of any given instrument. This statement may appear to be confusing and contradictory, but let us reduce it to a simpler form by explaining-

In case you were wondering, there is nothing particularly “clever” or scientific about the word “waveform”; the word has become a kind of catch-all reference to the data, which in this case, is the line on the oscilloscope screen. This particular example is an actual waveform of a single beat of a person’s heart, which incidentally, somewhat resembles the shape (waveform) of a spark event in a spark ignition engine.
Nonetheless, it does not matter if a waveform is created by a human heart, or by the secondary ignition system of a vehicle; both the heart and the ignition system work with electricity, which is what an oscilloscope uses to create the lines we know as waveforms.
As a practical matter, though, all oscilloscopes measure the difference in electrical potential between two test leads; the amplitude (height) of the waveform represents the intensity of the difference in potential, while the horizontal distance between the peaks of the waves represents the frequency of the signal over time. In this example, the flat lines on either side of the actual signal represent no measurable activity in the circuit being tested.
While this example shows only a single signal, single signals typically convey no useful diagnostic information on vehicles, unless the single signal being analyzed is an extract of a larger signal. Consider the image below-
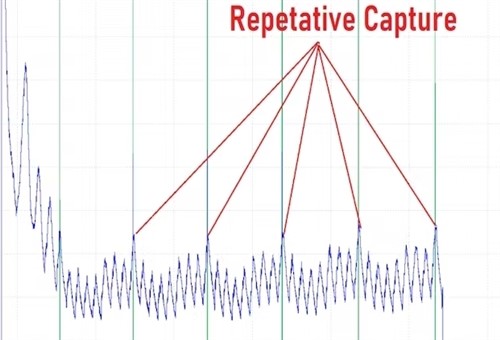
This example shows a waveform created by a cranking V8 engine during a relative compression test. This type is waveform is known as a repetitive capture since it shows several engine cycles that were recorded consecutively. Let us look at what this example shows, exactly.
Note that the screen is divided into six equal divisions and that the blue scope trace descends sharply in the first division. This part of the trace indicates the sharply decreasing battery amperage as the starter motor works to overcome the inertia of the stationary engine.
The following five divisions each represent 720 degrees of crankshaft rotation or one engine cycle, and each peak in each division represents the amperage draw of each cylinder during its compression stroke. Since it takes more power (current) to rotate the engine through each cylinder's compression stroke than it takes to rotate the engine through the other strokes that offer no resistance to the movement of the piston, each compression stroke is represented here by a peak in current draw.
This type of test is typically done by attaching an amp clamp around the positive battery cable, but the object at this point is not to identify which cylinder is misfiring; the object of this test is to see if all the cylinders develop the same level of compression pressure. If they do, all the peaks in this waveform would have the same height, since it would take the same amount of current to rotate each cylinder through its compressions stroke, but since these peaks do not have the same height, what are we looking at in this example? Consider the image below-
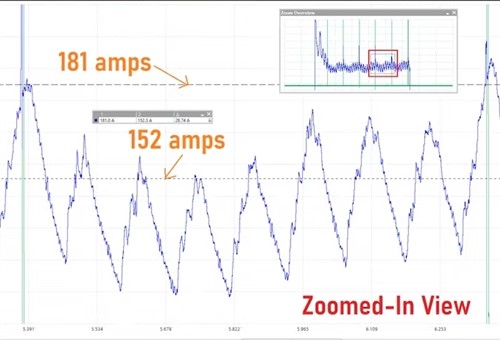
This image is a zoomed-in view of one division, or one engine cycle that was obtained by using moveable horizontal and vertical cursors to both measure the actual current draw of the cylinders and to define a single engine cycle. Note the small irregularities in each wave; these small peaks and valleys were created by small deviations in the current flow and typically indicate the added effort required to rotate camshafts and other valve train components. Depending on the abilities of the oscilloscope being used, it is possible to zoom into a single cylinder’s current draw profile to identify the points in the piston’s movement where the valves open and close with great precision.
Nonetheless, in this example, we are only interested in comparing the compression pressures in the cylinders. Note the dotted cursor line that starts at the extreme left; this line connects to a scale (not shown here) that indicates that one cylinder draws 181 amps, while the subsequent cylinders all draw significantly less, with the smallest draw being only 152 amps.
Although this does not identify the cylinders with the highest and lowest compression pressures, the most likely cause(s) of this pattern are a) excessive ring wear in most cylinders that causes excessive cylinder blowby or b), leaking valves that dump compression pressure into the exhaust system or intake manifold. While this type of compression difference between cylinders could also be caused by blown cylinder head gaskets, this is unlikely because damaged head gaskets typically produce smaller pressure differences than seen in this example.
Moreover, a relative compression test as shown in this example is definitive proof that this particular engine is suffering from mechanical issues, as opposed to electrical issues that typically do not produce differences in compression pressure between cylinders. Nonetheless, this particular diagnosis can be further refined by connecting a suitable pressure transducer (that converts pressure waves into electrical signals to either the exhaust outlet or the intake manifold. If the intake valves were leaking, the pressure waves in the intake manifold would correlate strongly with the relative compression test waveform. If, on the other hand, the exhaust valves were leaking, the pressure waves in the exhaust would also show a strong correlation to the relative compression waveform.
Similarly, if there were excessive cylinder blowby, a transducer connected to the oil filler hole in the valve cover would produce a waveform that will also show a strong correlation with the relative compression test waveform.
It is important to note though that “strong correlation” in this context does not translate into “match exactly”, because in some cases, some parts of the waveforms may be inverted relative to the compression test waveform. For instance, the cylinder with the highest compression pressure will leak the least, meaning that the pressure peak for that cylinder at the exhaust or intake manifold will be the lowest, which begs this question-
Although tests like the above are 100 per cent accurate when performed by a skilled operator, the amount of usable diagnostic data that all waveforms contain varies in direct proportion not only to the operator’s skill in terms of interpreting the obtained data but also in proportion to the abilities and capacity of the instrument being used. In a practical sense, it is impossible to overstate the importance of an oscilloscope’s limitations being considered in all tests, so let us look at-
Since oscilloscopes work by measuring and displaying electrical impulses over time, an oscilloscope’s sampling rate is an indication of how many impulses it can measure and display over time, which is typically expressed in seconds. One other critical parameter is an oscilloscope’s available memory, which determines how many samples are stored, and how many are simply dumped or deleted during the production of usable waveforms.
However, few, if any inputs derived from automotive components will ever overwhelm the memory capacity of an oscilloscope that is designed for use in the automotive industry, so for our purposes, we will focus only on sampling rates. This is a highly technical subject and most of the finer details fall outside the scope of this article, but for automotive applications, an oscilloscope should ideally have to ability to capture and process samples at a rate that is at least twice as high as the highest rate at which a component can generate samples. Put differently, this means that if something like say, a throttle control stepper motor can generate samples at a speed of 1000 (samples) per second, you’ll need an instrument that can process that number of samples in 0,5 seconds (double the sample generation rate) to produce a stable and useable waveform.
Fortunately, though, the designers of oscilloscopes intended for use in the automotive industry know this, and all modern automotive oscilloscopes can cope with any sampling speed almost any automotive component(s) can generate, so we don’t have to spend too much time discussing this aspect of oscilloscope design. Nonetheless, and despite the above, consider the image below-
Sadly, not all oscilloscopes sold in the automotive repair industry are designed to internationally accepted standards and norms. These instruments are mainly incorporated into many cheap generic scan tools that are made in the Far East, but are also offered as stand-alone, “competitively priced” oscilloscopes on many online retail sites.
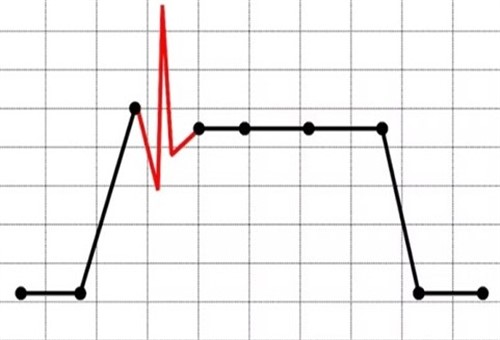
The image above shows a generic representation of a waveform that could have been taken with such an oscilloscope; i.e., one that could not process the samples the component being tested produced. In this example, the speed/second of the incoming samples overwhelmed the instrument’s memory, and as a result, it simply dumped or deleted those samples, which are represented here by the red part of the waveform.
Essentially, the red part of the waveform is lost data that could have contained valuable diagnostic data. As it happened, however, the instrument simply dumped consecutive samples until it was able to catch up, at which point it resumed producing a usable waveform. Depending on the magnitude of variations in the speed of the incoming samples, this pattern of lost data can/will be repeated every time the instrument’s memory is overwhelmed, which renders instruments like this useless for performing modern diagnostics, which raises the question of-
Given the fact that many diagnoses that would ordinarily have taken many hours to make can be made within minutes by using an oscilloscope intelligently, the best advice this writer can give anyone is to buy the best instrument that is available, as opposed to buying the best-priced instrument.
On the other hand, there is no point in buying an instrument that is best suited for use in an aerospace research facility for many thousands of dollars. Instead, one long-established supplier of oscilloscopes and related equipment to the global automotive industry sells only the software that turns a (new-ish) laptop computer (that you likely already own) into an advanced oscilloscope at very reasonable prices.
Moreover, this supplier also offers users of their products access to a vast library of known-good and known-bad waveforms that cover most faults on the vehicles we in the independent repair industry typically see in our bays, which saves you the trouble of learning how to figure out what a waveform is trying to tell you.
In addition, a reasonable subscription also gives you access to a community of thousands of experienced oscilloscope users from all over the world that are always ready to offer help, advice, and diagnostic insights as well as the ability to upload your own waveforms for the benefit of other users elsewhere in the world. If that is not enough, you can also get access to a huge number of guided tests that show you how to connect your oscilloscope to almost any component on most of the vehicles we see daily, which leaves us with this-
This article barely scratched the surface of the topic of how and why we should all use oscilloscopes more frequently, and while we only reference one example of how to cut down on diagnostic time, the fact is that there is almost no component on modern vehicles whose operation that cannot be checked, or diagnosed with oscilloscope waveforms.
We can list a few more examples here. We could, for instance, check the operation of CAN systems in minutes simply by connecting to the DLC instead of spending days unplugging control modules, and checking wiring. We could also make simple connections to an ignition system to check the operation of ignition coils, ignition driver circuits, and spark plugs, while using a second and third channel on the oscilloscope to verify ignition timing and actual fuel pressures, respectively, at the same time. Then again, we can also check and verify the operation of drive-by-wire throttle control systems, as well as check and verify the operation of oil control solenoids in variable valve timing systems, among many other control functions.
Note however that the above is not the same as saying that an oscilloscope can, or should replace all the diagnostic and test equipment we already own- far from it. Nevertheless, using an oscilloscope to narrow down the possible causes of most failures and defects will not only save you many hours of chasing down faults by other means, but it will also greatly reduce the number of times that you start down the wrong diagnostic path- as happens to some of us on occasion.