Also known as in-cylinder pressure sensors, in-cylinder pressure transducers represent a sort of mechanics’ Holy Grail, in the sense that these sensors allow us to see what is happening inside an engine when it is running, and particularly with respect to mechanical issues that would previously have required an engine teardown to identify. Now however, it is possible not only to diagnose compression, combustion, valve/camshaft timing and/or phasing, and ignition issues, but also to differentiate between the actual probable causes of compression losses and other issues simply by analysing a pressure waveform obtained with an in-cylinder pressure transducer. In this article then, we will take a closer look at in-cylinder pressure transducers in terms of what they are, and how they can augment your usual diagnostic tools/methods in ways that you never thought possible, starting with this question-
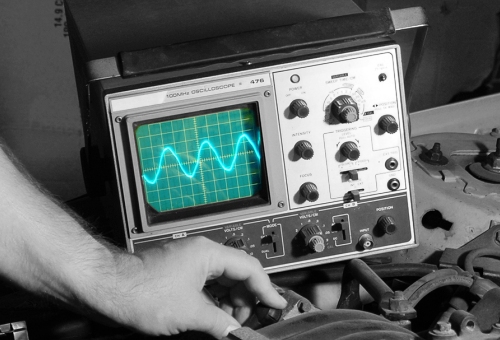
In its simplest form, a pressure transducer is a device that converts pressure into an electrical signal that can be displayed on an oscilloscope. Based on the frequency and amplitude of the displayed signal, certain conclusions can be drawn about the conditions that created the signal, but more importantly, based on deviations in, and/or aberrations of the displayed waveform, certain inferences can also be made about the possible fault conditions that created the deviations or aberrations.
In terms of operating principles, most* automotive pressure transducers contain piezoelectric discs or wafers that generate an electrical current when they are subjected to a pressure, which in this case, are the pressures that occur within a cylinder. Although the currents generated by automotive transducers are directly proportional to the pressures that obtain in modern engines, the currents are very small, and in most cases, a signal conditioner or amplifier is used between the transducer and the oscilloscope to create a usable waveform.
* Some newer designs are based on the refractive properties of light. In these designs, a flexible steel disc is used as a diaphragm that oscillates or vibrates in response to changing in-cylinder pressures. In practice, light is introduced into the transducer though fibre optic strands, and a signal is generated based on how the light is reflected off the disc as it deforms under changing pressures.
Nonetheless, while we do not need to delve into the technical differences between inductive, resistive, and capacitive transducers here, it is worth mentioning that most in-cylinder transducers are sensitive enough to register the minute fluctuations in pressure waves caused by worn valve guides, or valves that do not close securely because of valve spring oscillations.
However, in-cylinder transducers must not be confused with pressure transducers that are screwed into spark plug holes. While these tools have their uses, they are limited in their application because they cannot be used on running engines since they take the place of a spark plug, which begs this question-
Modern manufacturing methods have made it possible to place pressure transducers inside spark plugs and glow plugs, thus making it possible to obtain live, real time data (via an oscilloscope) on the exact conditions inside an engine cylinder while the engine is running.
In practice, spark plugs that are fitted with pressure transducers are the exact equivalents of normal plugs with respect to thread size, heat grade, resistance, and conductivity. Moreover, transducers are located in such a manner that flashovers cannot occur between the sensing element and the electrode(s) and in some designs, the actual transducer can be replaced by the user when it fails.
The same is true for glow plugs, with the exception that in most cases the actual transducer cannot be replaced individually. Nonetheless, transducer-equipped glow plugs are the exact operational equivalents of normal glow plugs in all respects.
One other type of in-cylinder pressure transducers are those that can be fitted directly into a cylinder head. These designs however, require that suitable holes be machined and tapped into the cylinder head, and while this is possible to do on some cylinder heads, the placement of multiple valves per cylinder often leaves no room for a transducer. Moreover, drilling and tapping holes into a cylinder head that was not designed to accommodate additional hardware is mostly a risky business, since transducers of this type require efficient cooling. While it may be possible to place the transducers so that they are in direct contact with the engine coolant, the additional holes can weaken the cylinder head to the point where it may crack or fracture under high thermal and/or clamping loads.
One experimental design involves the placement of miniaturised pressure transducers inside a multi-layer steel head gasket in such a manner that the sensors are in direct contact with in-cylinder pressures on the one hand, but also so that the sensors can be replaced without the need to remove the cylinder head, on the other. While initial tests have shown that the design is feasible, the high production cost of these gaskets and miniature transducers remain a significant problem for gasket manufacturers.
However, while some readers may find the above background information very interesting, the aim of this article is to show how in-cylinder transducers can be used to diagnose mechanical issues, which brings us to-
NOTE: Since limited space precludes the inclusion of dozens of known good and/or bad pressure waveforms, readers are encouraged to visit this resource to view examples of actual oscilloscope traces that will go a long way towards illustrating some of the points made in the section below.
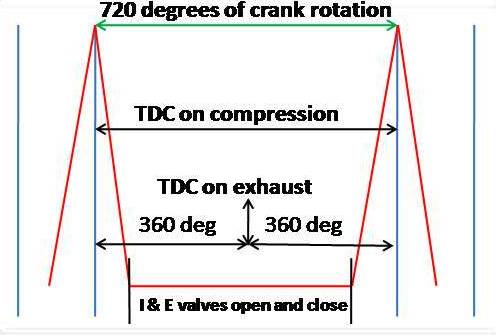
The diagram above represents a hugely simplified simulated pressure trace obtained from a transducer fitted to a spark plug on one cylinder of a petrol engine that is running at idle*. In this example, the horizontal axis represents degrees of crankshaft rotation, while the vertical axis represents combustion pressure. BDC positions have been omitted from this diagram for clarity.
*Note that waveforms obtained under snap-throttle conditions, or at engine speeds above idle are vastly different from those obtained at idling speeds. Therefore, different, and highly specialised techniques are required to interpret waveforms obtained at engine speeds above idling speed.
So, what does this diagram mean? Let us take things one at a time, but note that this article will not delve into issues such as valve durations relative to degrees of crankshaft rotation. All experienced technicians know (or should know) how many degrees a crankshaft in a standard engine must rotate before inlet and exhaust valves open and close during one four-stroke cycle. Therefore, this section will focus purely on the basic interpretation of in-cylinder pressure waveforms.
The two red spikes, also known as “combustion towers”, represent two successive maximum combustion pressure conditions in a single cylinder that coincide with the vertical blue lines that indicate the piston’s TDC position. In a healthy engine, the pressure ramps on both sides of the TDC position will be equal, or very close to equal, and this fact forms much of the foundation of the art of deducing the probable cause(s) of conditions that can cause the sides of a compression tower to be unequal.
In this example, the constant angle to the left of the first TDC position indicates a steady rise of the compression pressure in the cylinder, which peaks when the piston reaches TDC. The constant angle to the right of the TDC position indicates a steady decline of the combustion pressure as the piston moves downward towards BDC. Thus, in this example, the uniform, upright shape of the combustion tower indicates no significant losses of compression in the cylinder.
NOTE: In cases where an injector leaks and/or injects excessive amounts of fuel, the compression pressure will be higher than it will be on adjacent cylinders. Conversely, if the injector is defective or clogged and does not inject the correct volume of fuel, or misses one or more of multiple injections, the compression pressure will be lower than it will be on adjacent cylinders. In many cases, these conditions can be seen as secondary spikes on the upward or sometimes on downward pressure ramps near the pressure peak, since some injection events can occur after TDC.
If however, the angle to the right of the TDC position changes. i.e., it gets smaller, it means that combustion pressure is lost either past the piston rings, or through one or more leaking valves, which is where things can get complicated.
Camshaft phasing and valve durations
The horizontal red line between the two successive combustion towers in our example represents the angular motion of the crankshaft (as degrees of crankshaft rotation) during which first the exhaust valve(s) open(s) and close(s), before the intake valve(s) open(s) and close(s) in preparation for the next compression stroke.
Unlike our example trace, an actual oscilloscope trace will show multiple valleys and peaks in this section, but since these valleys and peaks represent changing pressure values (caused by valves opening and closing) that are directly related to the rotation of the crankshaft, the shapes and positions of these valleys can be valuable diagnostic aids.
However, to obtain this information, a second input must be obtained from the camshaft position sensor(s) to produce a second trace that can be superimposed on the pressure trace. Using the crankshaft’s angular rotation as indicated on the horizontal axis as a guide, the phasing of the camshaft(s) relative to the crankshaft position for the cylinder that is being tested could be checked against the TDC position of the relevant piston. Essentially, the upward and/or downward curve of the camshaft’s position waveform will intersect the TDC position, with the point of intersection indicating the camshafts’ phasing relative to the crankshaft, which brings us to-
While most misfires will set a dedicated misfire related trouble code if the cause is electrical in nature, mechanical causes of misfires will usually set cylinder balance or power contribution codes if the imbalance is big enough to produce fluctuations in the crankshaft’s rotational speed that are big enough to be detected by the misfire detection system.
Thus, by obtaining an input from the ignition spark trigger circuit of the cylinder being investigated, this third trace can be superimposed on the pressure and camshaft phasing traces. Since the spark delivery is dependent on the crankshaft’s position, each spark will produce a waveform whose peak will be placed at a specified distance BTDC. If the ignition trace remains constant relative to the peak of the pressure (and TDC position) waveform for a sufficiently large number of inputs for all the cylinders, an ignition related cause of the misfire could be ruled out.
If however, the ramp-up time for a coil is either too short or too long, this will be reflected in the ignition trace, but the trick is not necessarily to measure the deviation- the trick lies in spotting differences in the waveforms for each cylinder, particularly in the number and amplitudes of multi-sparking events. While conventional coil testing procedures may not reveal small deviations, these deviations almost always produce aberrations in pressure waveforms that are hard to confuse with mechanical causes of a misfire, which brings us to-
Mechanical causes of misfires
Any mechanical defect, such as bad camshaft/valve phasing, leaking valves, piston ring blow-by, broken, damaged, and/or excessively oscillating valve springs, and even worn valve guides will produce either a distinctive pressure waveform, or a distinctive aberration within a pressure waveform depending on the nature and severity of the problem. However, from a diagnostic perspective, the old adage that says the devil lives in the details is as true for automotive diagnostics as it is for everything else.
Since the deviation or aberration in a waveform can be influenced by factors like the engine temperature/speed, the overall condition of the engine, and even the type and viscosity of the oil in the engine, it should be obvious that the proverbial devil has many potential details to live in, and herein lays a problem, since an article of this type could not begin to discuss these types of details in any depth or detail.
In fact, even experienced oscilloscope users may find it very difficult to make sense of the waveforms that represent the opening and closing of the valves. Moreover, many may find it even more difficult to discern a correlation between these waveforms and one or more other waveforms racing across the screen at the same time, but there is a solution, which we will discuss in the-
While the combination of in-cylinder pressure transducers and oscilloscopes can offer real-time diagnostic insights that are not possible to obtain in any other way except through engine teardowns, it must be understood that interpreting the data correctly involves a long and extremely steep learning curve.
For instance, in cases where mechanical issues do not set fault codes, or where a fault code can have multiple mechanical causes, merely obtaining a screenshot of one or more oscilloscope traces is useless unless you have a reference waveform to compare yours with. Say for instance, a severely worn valve guide causes intermittent misfires; in this case, a compression test at cranking speed may or may not reveal a loss of compression, and a cylinder leak-down test may also not identify the cause, since the valve may be seated accurately at the time you perform the test.
Therefore, you decide to obtain a compression waveform at idling speed with an in-cylinder pressure transducer, but will you necessarily be able to ascribe the pressure fluctuations (which may be intermittent) in the waveform to a worn valve guide? Chances are excellent that if say, three mechanics examine the waveform, each will arrive at a different conclusion, and so the obvious answer is to compare the waveform with a known good example of a waveform taken from a similar, but preferably identical engine with known good valve guides.
However, in this writer’s experience, there are no useful online waveform libraries that are freely accessible, and no waveform libraries that contain waveform examples of all known faults on all engines. Thus, you have two choices; pay sometimes-hefty subscription fees to access two or more libraries, or build up your own collection of waveforms, and learn how to interpret them over a period of years.
Whatever route you take though, once you master the art of using in-cylinder pressure transducers and an oscilloscope to augment the other tools in your diagnostic toolbox, you will wonder how you ever managed to diagnose as many faults as you have with only a code reader and your gut feel.